

The speaking section of PTE test comprises a variety of tasks designed to evaluate the overall English speaking proficiency of test takers. While some tasks are relatively straightforward, others, such as “Describe Image,” can be more challenging. In this task, candidates encounter different types of visuals, and describing a PTE pie chart often proves to be the most difficult.
But don’t worry – here are some tips to score high on this question type. Make sure to bookmark this blog for future practice.
PTE Pie Chart Template:
Begin with a general introduction:
- “The pie chart illustrates the distribution of [main topic] among various categories.”
Mention the largest segment:
- “[Category] holds the largest share, accounting for approximately [percentage].”
Mention the second and third most significant segments:
- “This is followed by [category] with [percentage] and [category] with [percentage].”
Mention the smallest segment:
- “The smallest portion is represented by [category], contributing only [percentage].”
Add an overall observation or comparison:
- “Overall, the chart shows a clear difference in proportions, with [dominant category] being significantly higher/lower than the others.”
Conclude with a summary statement:
- “In conclusion, the pie chart effectively presents the variation in [main topic] across different categories.”
How To Use Template:
Talk About the Biggest and Smallest Sections
- The most significant portion is usually the most important—always mention it first.
- Also mention the smallest section because it shows contrast.
- Example: “Marketing holds the biggest share at 45%, while Customer Support is the smallest at only 5%.”
Mention 2–3 Other Important Parts
- You don’t need to read every number or category of PTE pie chart images.
- Choose 2 or 3 data points that are either similar in size or stand out in some way. It will help you focus on essential details.

Tips for PTE Describe Image Pie Chart:
1. Start describing the PTE pie chart with a simple introduction:
- First speak about the topic of the pie chart.
- Since time is limited, don’t overthink and start speaking what you see in the image.
Example: “The pie chart shows how different ratios that contribute to total sales.” This gives the listener (and the system) a clear start.
2. Use Comparison Words
- Using words like “higher than” or “almost equal” shows that you understand the data. It’s better than just listing numbers.
| Function | Comparison Words/ Phrases |
| Similarity | Similarly, Likewise, In the same way, Just as, As well as, Equally, Correspondingly, Alike, In like manner, Comparable to |
| Contrast / Difference | However, On the other hand, Whereas, While, Although, Even though, In contrast, Unlike, Nevertheless, Yet, Conversely, Despite, But |
| Degree of Comparison | More than, Less than, As much as, As little as, As many as, As few as, Just as…as, Not as…as, So…as |
Example: “Production and Sales have similar values, but both are lower than Marketing.”
3. Speak Clearly and Naturally
- Fluency and pronunciation are very important in PTE.
- Speak at a normal pace—don’t rush or speak too slowly.
- Avoid fillers like “um”, “uh”, or long pauses.
- If you make a mistake, just keep going—don’t stop.
4. Keep It within 35–40 Seconds
- You get 40 seconds to speak, but aim to finish in around 35–38 seconds.
- If it’s too short, your response may sound incomplete.
- If it’s too long, it may be cut off or sound rushed.
5. Use Easy Vocabulary
- Simple words like “shows,” “represents,” “highest,” “lowest,” “almost,” “similar” are enough.
- You don’t need advanced vocabulary or complex grammar.
- Clear communication is more important than using fancy words.
6.Practice with Real Pie Charts
- Look for real pie charts in PTE study materials or do free question-wise practice on Gurully.
- Practice describing them aloud using the tips above.
- Record yourself and listen to improve your pronunciation, speed, and fluency.
7. Stay Calm and Confident
- Even if you don’t know much about the topic, no worries just describe what you see.
- Confidence and regular practice will help you speak naturally and clearly.
PTE Pie Chart Most Repeated Questions with Answers
Below are sample PTE pie chart with answer which will help you in practicing.
PTE Pie Chart 1: Smartphone Market Share by Brand
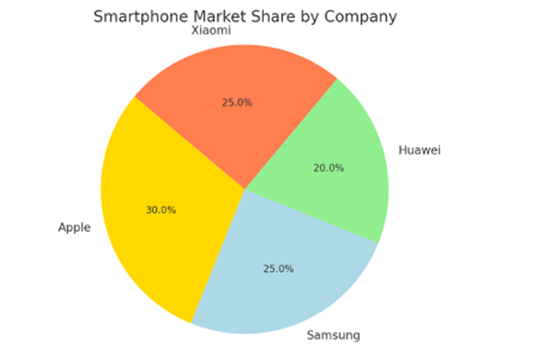
Description:
The pie chart represents the smartphone market share of different brands. Apple leads with 30%, followed by Samsung and Xiaomi, both at 25%, while Huawei holds the smallest share at 20%. The data indicates a highly competitive market, with Apple holding the largest share. The relatively equal distribution suggests strong competition among top brands.
PTE Pie Chart 2: Energy Consumption by Sector
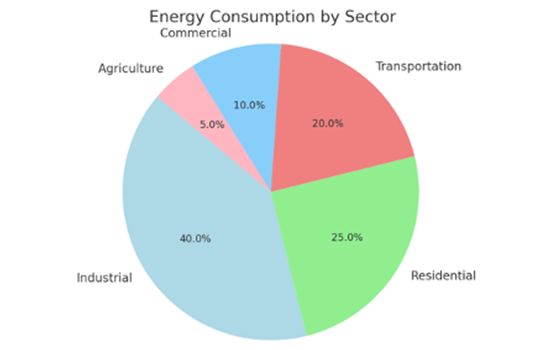
Description:
The pie chart represents energy consumption across different sectors. The industrial sector accounts for the highest consumption at 40%, followed by residential at 25%. Transportation contributes 20%, while agriculture and commercial use make up the smallest shares at 10% and 5%, respectively. The data suggests a heavy reliance on industrial energy consumption, with transportation and residential usage also playing significant roles. It highlights the importance of energy efficiency and renewable alternatives in high-consumption sectors.
PTE Pie Chart 3: Transportation Mode Usage Distribution
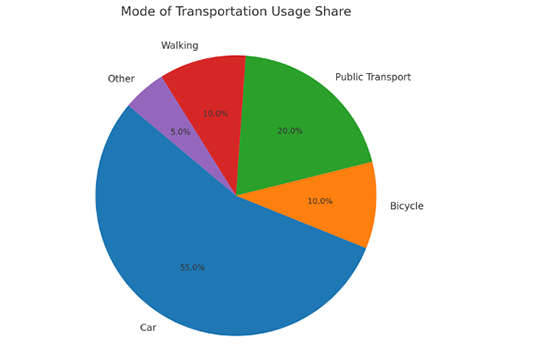
Description:
The pie chart represents different transportation modes and their usage shares. Cars dominate with 55%, followed by public transport at 20%. Walking and bicycles each account for 10%, while other modes make up 5%. The data suggests a heavy reliance on private vehicles, though public transport remains significant, especially in urban areas.
PTE Pie Chart 4: Investment Distribution by Sector in 2023
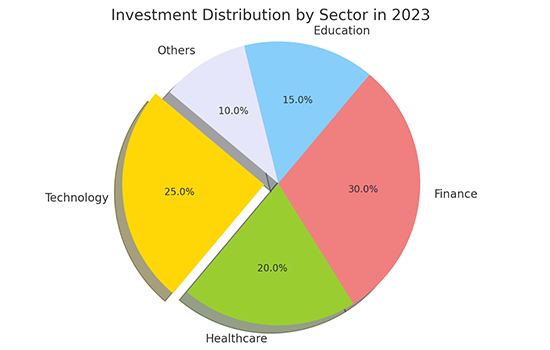
Description:
The pie chart illustrates the distribution of investments across sectors in 2023. Finance accounts for the largest share at 30%, followed by technology and healthcare at 25% and 20%, respectively. Education and other sectors make up the remaining 35%, reflecting strategic investment priorities.
PTE Pie Chart 5: Market Share by Sector in 2023
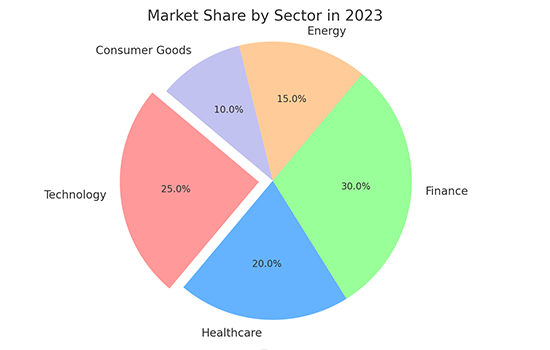
Description:
This pie chart shows the 2023 market share distribution across five sectors. Finance leads with 30%, followed by technology at 25%. Healthcare holds 20%, energy 15%, and consumer goods 10%. Each sector is color-coded for clarity. Finance and technology form over half the market, indicating their strength, while energy and consumer goods have the smallest shares.
PTE Pie Chart 6: Industry Market Share in 2023
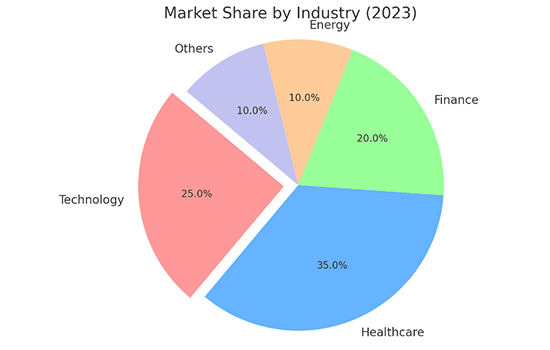
Description:
The pie chart illustrates the 2023 market share by industry. Healthcare leads with 35%, followed by technology at 25%, finance at 20%, and energy at 10%. The remaining 10% falls under ‘Others’. The color-coded design enhances clarity. The chart highlights healthcare’s dominance, indicating high demand, while technology and finance remain significant sectors with notable contributions.
PTE Pie Chart 7: Distribution of Marital Status
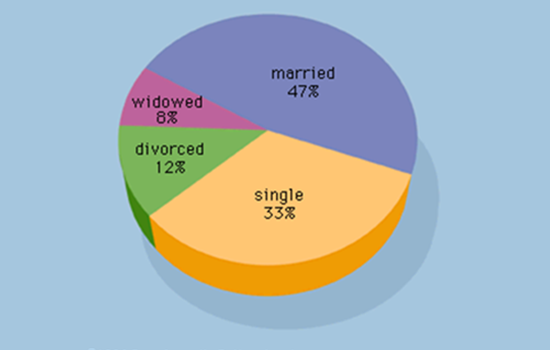
Description:
This pie chart illustrates the distribution of marital statuses. The majority of the population is married, accounting for 47%. Single individuals make up 33%, followed by divorced at 12%. Widowed individuals represent the smallest portion, at 8%. The chart suggests that married individuals form nearly half the population, with single and divorced people making up the rest.
PTE Pie Chart 8: Coffee Shop Expense Breakdown
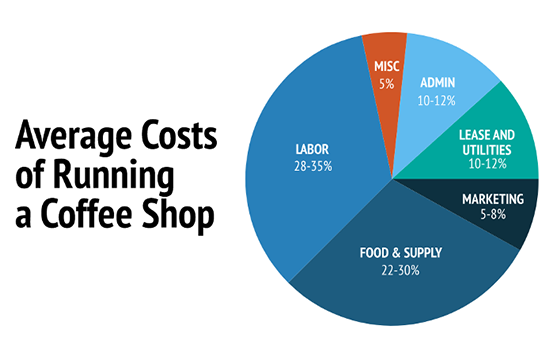
Description:
The pie chart breaks down the expenses involved in running a coffee shop. The largest cost component is labor, accounting for 28-35%, followed by food and supply expenses at 22-30%. Lease, utilities, and administrative costs contribute around 10-12% each, while marketing expenses range between 5-8%. Miscellaneous costs make up 5%. The chart highlights that staffing and inventory are the most significant cost factors in coffee shop operations.
PTE Pie Chart 9: Ship Market Shares and Categories in Q1 2019
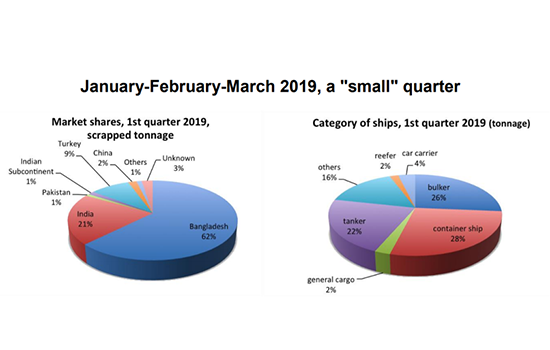
Description:
The pie charts depict scrapped ship market shares and ship categories in the first quarter of 2019. Bangladesh leads the market with 62% of scrapped tonnage, followed by India at 21%. The largest ship categories scrapped include container ships (28%) and bulkers (26%), with tankers and other ships making up the rest. The data indicates that South Asia dominates ship recycling, and container ships form the largest scrapped category.
While tips and strategies are helpful, consistent practice is the key to achieving your desired PTE score. To boost your preparation, make the most of Gurully’s all-in-one platform that offers full-length PTE mock tests and section-wise test and free question-wise practice tailored to your needs. With real-time scoring and detailed feedback, you can track your progress. Take advantage of one free mock test and start your preparation today.
Conclusion:
The Describe Image task, particularly when it involves pie charts, can be challenging for many PTE test-takers. However, with the proper structure, precise observations, and consistent practice, you can tackle it confidently. Focus on the main segments, use comparison words, and keep your speech natural and within the time limit.
To support your preparation, Gurully offers targeted practice tools, real-time scoring, and a free mock test to help you improve step by step. You can also take benefit of free question-wise practice, which includes 10 AI scoring coupons. This will help you evaluate your performance and plan your preparation more effectively.
Also Read:
- PTE Map Chart – Tips, Template, & Sample Questions With Answers
- PTE Describe Image Template 2025 – Practice with 50 Examples
- Gurully’s PTE Study Material – Guide for Your Exam Success
- Practice With 70+ Most Repeated PTE Write from Dictation Questions
Free PTE Practice Test